Our main objective is to improve the sustainability of forests in India by developing multi-satellite sensor-based observational portal system and integrating physical and social science data to quantify the value of ecosystem services

The Situation
By providing numerous ecosystem services (air and water purification, disease and cyclone mitigation, carbon storage and sequestration, support for biodiversity, provision of fuelwood, to name just a few), India’s forest cover, which spans ~70 M hectares, directly affects the livelihoods of over 300 million people.
However, India’s rapid economic and population growth have adversely impacted forests. For example, India has lost nearly 80% of its native forest cover between1860 and 1990s, and according to Global Forest Watch, it lost 371kha or 3.6% of its humid primary forests between 2002 and 2021.
The rapid loss of forest cover highlights the need to promote sustainable development in the country. This, in turn, necessitates an integrated physical-social science approach to effectively model the relationship between forest ecosystems and human well-being. This is the focus of the Remote Sensing for Forest Renewal, Ecosystem Services, and Sustainable Hydrological Management (REFRESH) project, in which the potential intervention strategies were co-designed with USAID, and the Indian partners.
The ultimate goal of the REFRESH project is to support the Government of India towards policies on pan-India forests.
Our Work
The REFRESH project aims to help promote sustainability in India by (1) developing an innovative geodetic and remote sensing satellite-based forestry monitoring system, (2) linking remote sensing data to the provision of ecosystem services and human welfare, and (3) providing spatially explicit maps of ecosystem services to guide the siting of potential payments for ecosystem services schemes.
The geodetic and remote sensing satellite-based forestry monitoring system
The project uses a constellation of multi-band, multi-sensor scientific satellites, including all-weather (radar) sensors, with near-real time data at different spatio-temporal resolutions, and derive distinct forestry, surface/ground water, floods/droughts, and environmental variables. The approach is to develop and demonstrate the state-of-the-art multi-satellite sensor-based observational portal system with efficient open-source Machine Learning-aided big data analyses and processing, to holistically quantify physical processes impacting pan-India forestry, and to monitor natural hazards, water resources, and ecological changes.
This work includes:
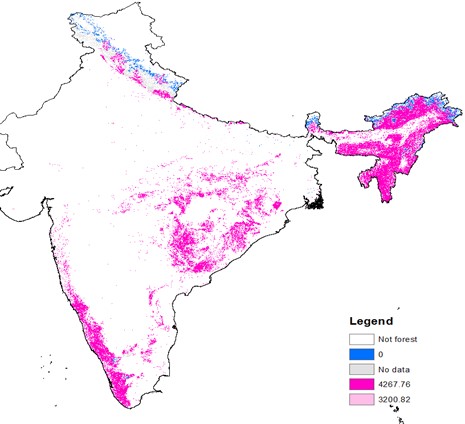
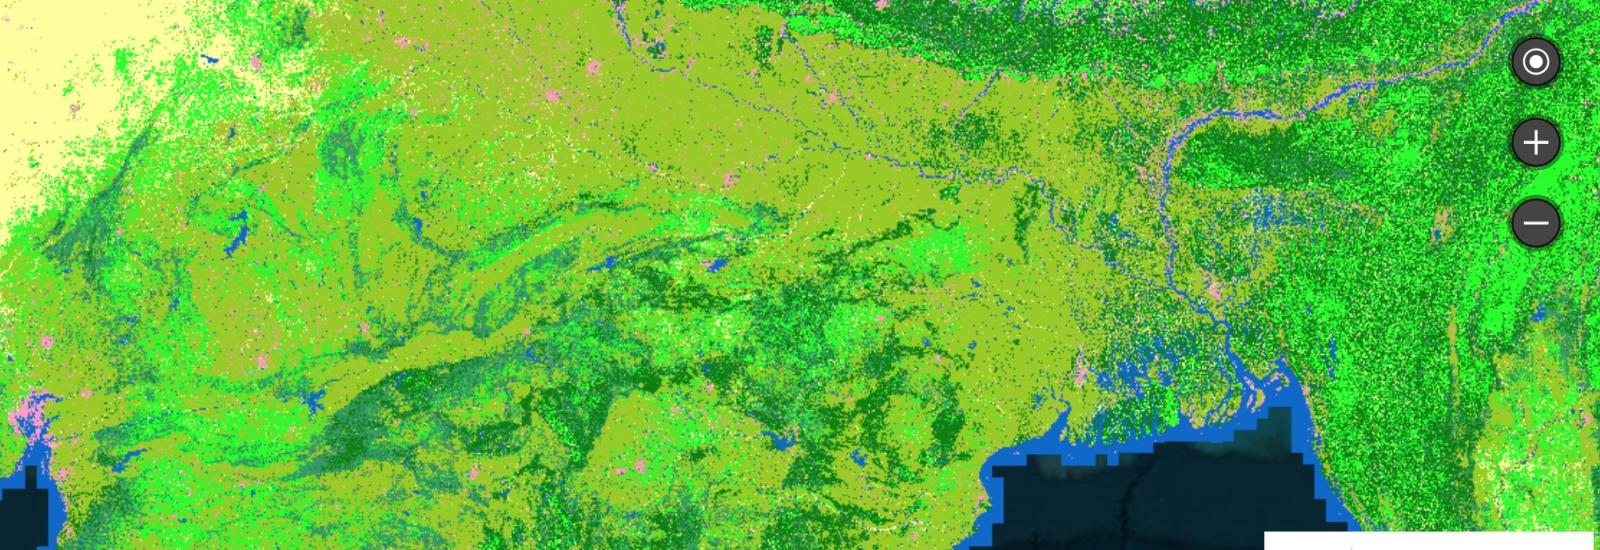
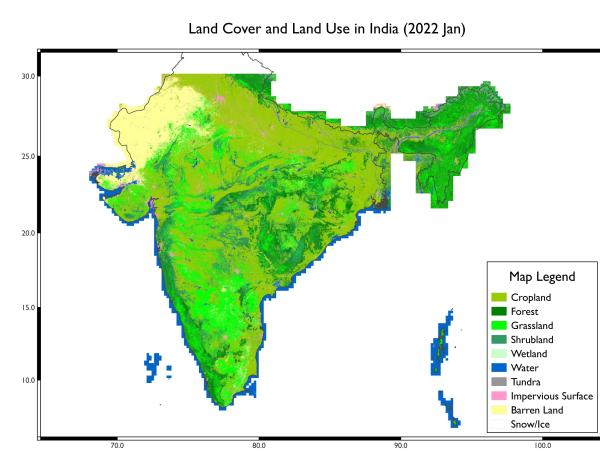
- Deep-Learning aided Land Use Land Cover classification
- Ground water storage changes
- Forest fire detection
- Flood monitoring
- Inland surface water level monitoring
- Estimation of forest canopy height and aboveground biomass
- West Bengal estuary mangrove forest wetland water level monitoring
The project outcomes have been consolidated into an observational portal system including state-of-the-art satellite data, along with guidance documents, which can be accessed here https://go.osu.edu/ REFRESH-Forest (beta version). The satellite-based portal is an innovative API with novel visualizations, on-demand data project retrieval covering the pan-India forest study regions.
Quantifying the value of ecosystem services

We use remote sensing data to quantify the change in forests. Using a combination of rigorous impact evaluation and non-market valuation methods, we translate changes in forest cover to changes in the provision of ecosystem services, and then to changes in human wellbeing. Specifically, the ecosystem services we consider are the mitigation of cyclone impacts in coastal areas, the provision of drinking water and water for irrigation, the mitigation of diseases (malaria, diarrhea, and acute respiratory infections), carbon storage, and fuelwood provision.
Translating the impact on the ground
Our project will disseminate spatially explicit maps of ecosystem services; these can guide the siting of future payments for ecosystem service interventions. Further, we will conduct capacity building exercises to train the trainers of the next generation of forestry stakeholders, expand job skill and training entrepreneurship for forestry inhabitants, while promoting an inclusive and empowering process to improve gender equality and empower women.